AI SEO Reports
Minorank's AI report generator produces professional, executive-ready SEO reports in one click. Reports are written by Minorank AI and pull live data from Google Search Console, Google Analytics 4, and competitor analysis, covering every angle of organic performance in a single document.
What's in an AI report
Each report contains up to 16 structured sections, all populated with live data:
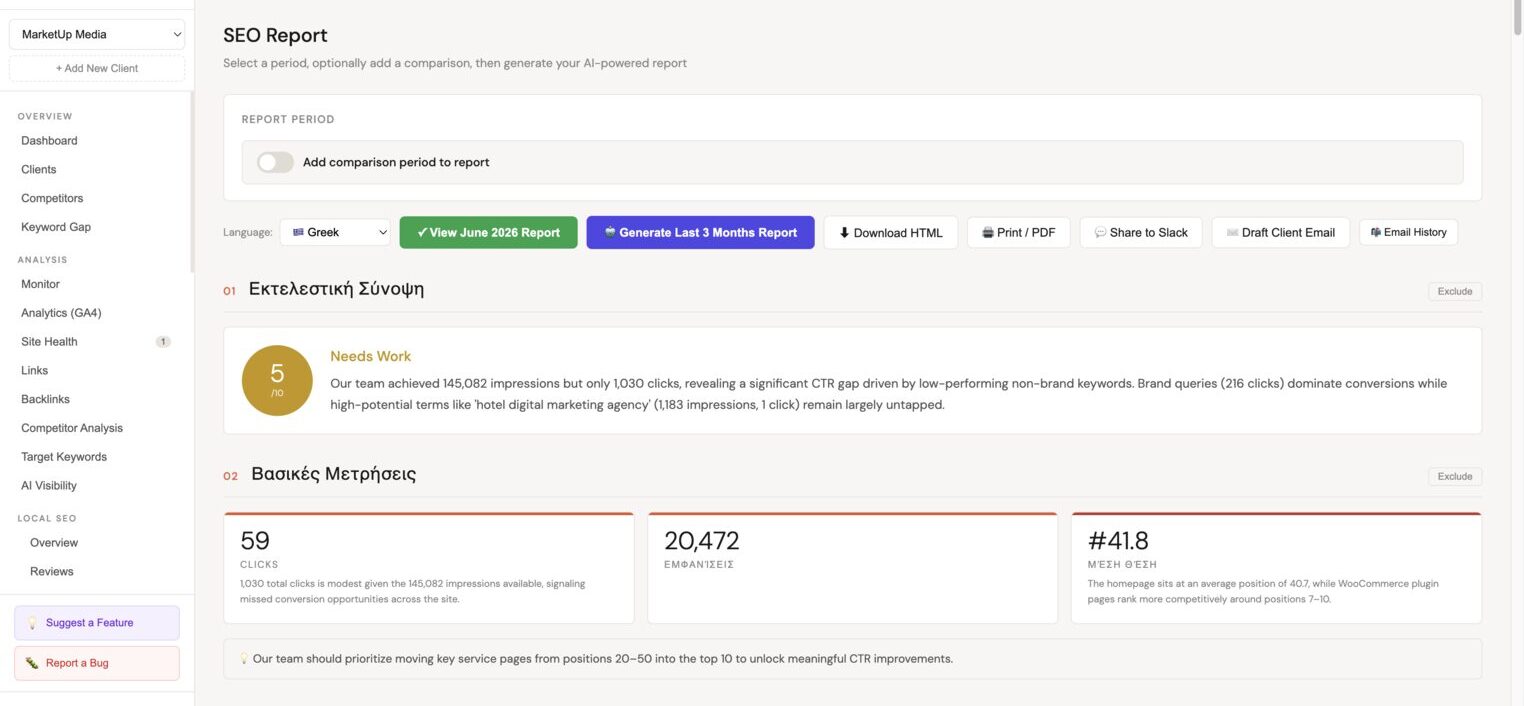
1. Executive Summary
Plain-language overview of the client's SEO performance for the period. Highlights the most important wins and concerns, written to be understood by non-technical stakeholders.
2. KPIs
Key performance indicators vs the previous comparison period:
- Total organic clicks (and % change)
- Total impressions (and % change)
- Average CTR (and % change)
- Average keyword position (and % change)
3. Traffic Trend
Narrative analysis of the 16-month traffic chart, explains inflection points, growth or decline periods, and likely causes based on the pattern.
4. Highlights
3–5 bullet-point highlights from the period: biggest keyword gains, notable traffic drops, new pages entering the top 10, etc.
5. Top Queries
Analysis of the keywords driving the most organic clicks. Identifies which queries are growing, which are declining, and which have strong impressions but low CTR.
6. Top Pages
Performance breakdown by URL. Surfaces the site's most valuable pages and identifies URLs losing traffic or performing below expected CTR.
7. Devices & Countries
Traffic split by device type (desktop / mobile / tablet) and top countries. Useful for identifying mobile UX issues or market-specific opportunities.
8. Brand vs Non-Brand
Separation of branded queries (containing the client's brand name) from non-branded queries. Brand traffic reflects awareness; non-brand traffic reflects SEO reach.
9. Keyword Insights
Deep analysis of the keyword landscape, position distribution, keywords entering or exiting the top 10, and position volatility.
10. CTR Opportunities
A table of keywords ranking in positions 1–10 with below-average CTR. These pages are visible but not being clicked, title tag and meta description optimisation can recover traffic without any ranking work.
11. Page 2 Keywords
Keywords currently ranking in positions 11–20, the "quick win" list. A focused effort on these pages can move them to page 1 and deliver traffic increases quickly.
12. SEO Opportunities
AI-identified opportunities specific to this client's data, new content topics, technical fixes, or optimisation priorities.
13. Action Plan
Numbered, prioritised list of SEO actions for the coming month. Each action includes rationale and expected impact (high / medium / low).
14. Comparison
Side-by-side comparison of the current period vs the previous period across all key metrics.
15. Target Keywords Progress
Status of each tracked target keyword, position, movement, and whether it's on track for the goal.
16. Next Steps
Closing section summarising the period covered, the next report date, and any outstanding setup items.
Monitor sections (additional)
When site monitoring data is available, the report also includes:
- Traffic trend monitoring, week-over-week alert history
- PageSpeed, Core Web Vitals and performance scores
- Rank movement, month-over-month position changes across tracked keywords
- Backlinks, new and lost referring domains in the period
- Published content, articles published since the last report
- Competitor organic traffic, traffic trend comparison for all added competitors
Generating a report
- In the client sidebar, navigate to Reports → AI Reports.
- Click Generate new report.
- Configure the report:
- Reporting period, date range to cover (default: last 28 days vs prior 28 days)
- Language, write the report in Greek or English
- Include competitors, toggle to include competitor data (requires at least one competitor added)
- Sections, optionally exclude sections not relevant for this client
- Click Generate report.
Generation takes 15–45 seconds depending on data volume.
:::note Data requirements Google Search Console must be connected to generate a report. GA4 and competitor data enrich the report but are not required. A report without GA4 will omit traffic correlation analysis. :::
Viewing and sharing reports
Reports appear in the Reports list with a timestamp. Click to open the full interactive view.
From the report view you can:
- Export to PDF, generates a branded PDF for client delivery
- Copy shareable link, a read-only link you can send directly to the client
- Duplicate, re-run with different settings for comparison
Report history
All generated reports are saved. Each generation creates a new entry, reports are never overwritten, so you have a complete history per client.
:::tip Monthly rhythm Most agencies generate reports on a 28-day cycle. The comparison period is automatically set to the prior 28 days, giving you a clean month-over-month view without calendar month edge cases. :::